Guide To The BCG Matrix and Its Relation To Agile
Introduction To The BCG Matrix And Its Connection To The Agile Method
Though Agile is a product-oriented approach, for a long period of time, it was only focusing on a single product. Scrum, the most widespread of Agile frameworks, is no different. It’s a great framework for a product development and cross functional teams, but its shortcomings become all the more obvious when it comes to multiple products being developed in parallel.
You don’t need to be a huge company to have multiple products; even two are enough to make you ask which one is more important right now? Which one should be developed? How should we prioritize product development tasks in conjunction with each other?
You might also be interested in: Agile Leadership Has the Power to Transform Your Business
The above questions became increasingly important as the need for scalability of Agile frameworks showed high growth rates. Even some scaled frameworks are unable to adequately answer them. Perhaps SAFe provides the best solution, where separate levels are given to the product portfolio, allowing for an agile management of it.
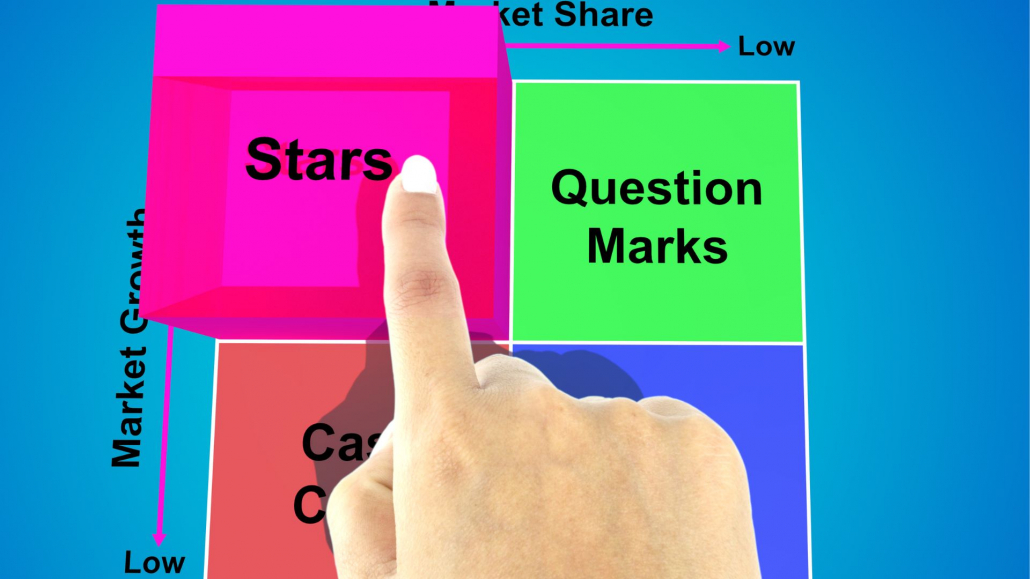
A simple way to handle the product portfolio is provided by the so-called BCG matrix (also known as growth-share matrix), which got its name from the Boston Consulting Group. The matrix shows two factors that organizations must consider when deciding where to invest:
- competitive advantage
- market growth
Based on these, the products are classified in a two-by-two grid, with the categories being question marks, stars, dogs and cash cows.
The goal of the BCG matrix
The goal of using a BCG matrix is to
- Identify each product’s place on a product life cycle curve
- Find the optimal development strategy and market positioning based on its current position in its life cycle
- Examine products’ relative position to each other and adjust the product portfolio accordingly
In order to understand the matrix, it’s important to revise what we know about the product life cycle. The curve splits a product’s life into four phases.
- Introduction: With the product being new, its success is questionable. Main objective is bringing it to the market and testing unique selling points and the product itself under market conditions.
- Growth: In case of a successful introduction, the product finds its buyers. Early majority comes after early adopters, interest in the product grows and competitors along with followers emerge.
- Maturity: Usually the longest of all phases. By the time the product enters this phase, competition becomes more intense. In order to hold its market position, the product requires constant development and innovation.
- Decline: The market for the product shrinks with the product becoming obsolete. Once the development is finished, the organization focuses on other products.
Categories of the BCG Matrix
The are 4 categories which are dogs, cash cows, stars and question marks – 1 for each quadrant. This helps organizations to prioritize their business activities.
-
Stars
The product has a high market cap in a growing market. This is the growth phase. Stars have high business potential with this being the best strategic position. Challenges here are catering to growing needs and preserving advantage over competitors, which usually leads to more development being needed. Stars are in an especially important position, as their goal is to preserve their success and turn into cash cows down the road.
-
Cash cows
Products with a high market cap in a slowing market. These products are in their mature phases. The goal is to prolong this phase, maximizing profit. Development costs here are low, but nevertheless they’re still there. Tracking, support and updates are crucial. Cash cows generate large profits that could cover the costs of developing new products.
-
Question marks
Lower market cap products on a dynamic market, being in their introductory phase. Huge potential to turn into stars, even though this might require hefty investments. Agile plays a vital role here: incremental development, customer feedback and regular delivery can all contribute to learning whether or not they’re capable of fulfilling their potential to become stars or they’re not worth the effort.
-
Dogs
Slowing or shrinking market, low market cap. This is the decline phase. These products are often unprofitable, and from a portfolio management standpoint; terminating these products is often the way to go.
The above system can be applied to numerous international companies, such as Toyota, Samsung, Apple or Nestlé. Apple’s matrix-plotting is especially spectacular, as the brand has several top selling products.
Advantages and disadvantages of the BCG matrix
The matrixes are quick and easy-to-use tools for analysis. Like similar tools, they are somewhat restricted in their use, as the number of factors examined is few. It could come in handy when a quick overview is what’s needed; however, more complex portfolios require some more advanced tools. The greatest disadvantage of BCG matrix is that its static, meaning they only reflect the state of things in a given moment; therefore, it’s worth conducting the analysis multiple times during a period of time.
Leave a Reply
Want to join the discussion?Feel free to contribute!